How to Show All Running Processes in Linux
This post will guide you how to show all running processes using ps or top command in Linux Operating system. How do I Use the top command to show running process in Linux.
- Show All Running Processes with PS Command
- Show All Running Processes by a Given User
- Show All Running Processes with top Command
- Show All Running Processes as a Tree
- Show All Running Processes Tree with ps Command
- Look up Processes based on Process name
- Show All Running Processes using htop Command
- Show All Running processes using atop Command

Show All Running Processes with PS Command
If you want to show all running processes at the shell prompt in your Linux, and you can type one of the following ps commands, type:
$ ps -aux | less
Outputs:
USER PID %CPU %MEM VSZ RSS TTY STAT START TIME COMMAND
root 1 0.0 0.4 225612 4204 ? Ss Sep08 0:04 /sbin/init splash
root 2 0.0 0.0 0 0 ? S Sep08 0:00 [kthreadd]
root 3 0.0 0.0 0 0 ? I< Sep08 0:00 [rcu_gp]
root 4 0.0 0.0 0 0 ? I< Sep08 0:00 [rcu_par_gp]
root 6 0.0 0.0 0 0 ? I< Sep08 0:00 [kworker/0:0H-kb]
root 8 0.0 0.0 0 0 ? I< Sep08 0:00 [mm_percpu_wq]
root 9 0.0 0.0 0 0 ? S Sep08 0:00 [ksoftirqd/0]
root 10 0.0 0.0 0 0 ? I Sep08 0:02 [rcu_sched]
root 11 0.0 0.0 0 0 ? S Sep08 0:00 [migration/0]
root 12 0.0 0.0 0 0 ? S Sep08 0:00 [idle_inject/0]
root 14 0.0 0.0 0 0 ? S Sep08 0:00 [cpuhp/0]
root 15 0.0 0.0 0 0 ? S Sep08 0:00 [kdevtmpfs]
root 16 0.0 0.0 0 0 ? I< Sep08 0:00 [netns]
root 17 0.0 0.0 0 0 ? S Sep08 0:00 [rcu_tasks_kthre]
root 18 0.0 0.0 0 0 ? S Sep08 0:00 [kauditd]
root 19 0.0 0.0 0 0 ? S Sep08 0:00 [khungtaskd]
root 20 0.0 0.0 0 0 ? S Sep08 0:00 [oom_reaper]
root 21 0.0 0.0 0 0 ? I< Sep08 0:00 [writeback]
root 22 0.0 0.0 0 0 ? S Sep08 0:00 [kcompactd0]
root 23 0.0 0.0 0 0 ? SN Sep08 0:00 [ksmd]
root 24 0.0 0.0 0 0 ? SN Sep08 0:00 [khugepaged]
root 25 0.0 0.0 0 0 ? I< Sep08 0:00 [crypto]
root 26 0.0 0.0 0 0 ? I< Sep08 0:00 [kintegrityd]
root 27 0.0 0.0 0 0 ? I< Sep08 0:00 [kblockd]
root 28 0.0 0.0 0 0 ? I< Sep08 0:00 [tpm_dev_wq]
root 29 0.0 0.0 0 0 ? I< Sep08 0:00 [ata_sff]
root 30 0.0 0.0 0 0 ? I< Sep08 0:00 [md]
root 31 0.0 0.0 0 0 ? I< Sep08 0:00 [edac-poller]
root 32 0.0 0.0 0 0 ? I< Sep08 0:00 [devfreq_wq]
root 33 0.0 0.0 0 0 ? S Sep08 0:00 [watchdogd]
root 37 0.0 0.0 0 0 ? S Sep08 0:17 [kswapd0]
root 38 0.0 0.0 0 0 ? I< Sep08 0:00 [kworker/u3:0]
root 39 0.0 0.0 0 0 ? S Sep08 0:00 [ecryptfs-kthrea]
Show All Running Processes by a Given User
If you want only show all running processes by effective user ID or name, and you can pass the -u option and username to the ps command. For example, you want to list all processes by a user named “devops”, you can type the following command:
$ ps -u devops
Outputs:
devops@devops:~$ ps -u devops
PID TTY TIME CMD
3958 ? 00:00:00 systemd
3959 ? 00:00:00 (sd-pam)
4558 ? 00:00:00 gnome-keyring-d
4562 tty2 00:00:00 gdm-x-session
4564 tty2 00:00:09 Xorg
4576 ? 00:00:00 dbus-daemon
4580 tty2 00:00:00 gnome-session-b
4676 ? 00:00:00 ssh-agent
4678 ? 00:00:00 at-spi-bus-laun
4683 ? 00:00:00 dbus-daemon
4686 ? 00:00:00 at-spi2-registr
4704 tty2 00:01:25 gnome-shell
4710 ? 00:00:00 gvfsd
4715 ? 00:00:00 gvfsd-fuse
4727 ? 00:00:00 pulseaudio
Show All Running Processes with top Command
If you want to display a dynamic real0time view of all running processes in your Linux system, and you can type the top command at the shell prompt:
$ top
Outputs:
top - 06:28:49 up 8:28, 2 users, load average: 0.07, 0.03, 0.00
Tasks: 282 total, 1 running, 248 sleeping, 0 stopped, 0 zombie
%Cpu(s): 2.2 us, 0.3 sy, 0.1 ni, 97.3 id, 0.1 wa, 0.0 hi, 0.0 si, 0.0 st
KiB Mem : 1006668 total, 118424 free, 689460 used, 198784 buff/cache
KiB Swap: 2097148 total, 947708 free, 1149440 used. 159200 avail Mem

PID USER PR NI VIRT RES SHR S %CPU %MEM TIME+ COMMAND
11668 devops 20 0 51320 3856 3132 R 17.6 0.4 0:00.05 top
1 root 20 0 225612 4204 2536 S 0.0 0.4 0:04.55 systemd
2 root 20 0 0 0 0 S 0.0 0.0 0:00.01 kthreadd
3 root 0 -20 0 0 0 I 0.0 0.0 0:00.00 rcu_gp
4 root 0 -20 0 0 0 I 0.0 0.0 0:00.00 rcu_par_gp
6 root 0 -20 0 0 0 I 0.0 0.0 0:00.00 kworker/0:0H-kb
8 root 0 -20 0 0 0 I 0.0 0.0 0:00.00 mm_percpu_wq
9 root 20 0 0 0 0 S 0.0 0.0 0:00.84 ksoftirqd/0
10 root 20 0 0 0 0 I 0.0 0.0 0:02.19 rcu_sched
11 root rt 0 0 0 0 S 0.0 0.0 0:00.23 migration/0
12 root -51 0 0 0 0 S 0.0 0.0 0:00.00 idle_inject/0
14 root 20 0 0 0 0 S 0.0 0.0 0:00.00 cpuhp/0
15 root 20 0 0 0 0 S 0.0 0.0 0:00.00 kdevtmpfs
16 root 0 -20 0 0 0 I 0.0 0.0 0:00.00 netns
17 root 20 0 0 0 0 S 0.0 0.0 0:00.00 rcu_tasks_kthre
18 root 20 0 0 0 0 S 0.0 0.0 0:00.00 kauditd
19 root 20 0 0 0 0 S 0.0 0.0 0:00.05 khungtaskd
20 root 20 0 0 0 0 S 0.0 0.0 0:00.00 oom_reaper
21 root 0 -20 0 0 0 I 0.0 0.0 0:00.00 writeback
22 root 20 0 0 0 0 S 0.0 0.0 0:00.06 kcompactd0
23 root 25 5 0 0 0 S 0.0 0.0 0:00.00 ksmd
24 root 39 19 0 0 0 S 0.0 0.0 0:00.00 khugepaged
25 root 0 -20 0 0 0 I 0.0 0.0 0:00.00 crypto
26 root 0 -20 0 0 0 I 0.0 0.0 0:00.00 kintegrityd
27 root 0 -20 0 0 0 I 0.0 0.0 0:00.00 kblockd
Note: if you want to quit from the view of top command, and you can press q key on your keyboard.
Show All Running Processes as a Tree
If you want to display a tree of all running processes in Linux, and you can use the pstree command, type:
$ pstree
Outputs:
devops@devops:~$ pstree
systemd─┬─ModemManager───2*[{ModemManager}]
├─NetworkManager───2*[{NetworkManager}]
├─accounts-daemon───2*[{accounts-daemon}]
├─acpid
├─apache2───5*[apache2]
├─avahi-daemon───avahi-daemon
├─beam.smp─┬─erl_child_setup─┬─cpu_sup
│ │ ├─memsup
│ │ └─sh
│ └─20*[{beam.smp}]
├─boltd───2*[{boltd}]
├─colord───2*[{colord}]
├─cron
├─cups-browsed───2*[{cups-browsed}]
├─cupsd
├─dbus-daemon
├─dhclient
├─dnsmasq
├─epmd
├─fwupd───4*[{fwupd}]
……
Show All Running Processes Tree with ps Command
If you want to show all running processes tree using ps command at your shell prompt in Linux, and you can pass the –ejH or axjf options to ps command, type:
$ ps -ejH
Or
$ ps -axjf
Outputs:
1129 1288 1288 1288 ? -1 Ss 125 0:00 \_ erl_child_setup 1024
1288 1617 1617 1617 ? -1 Ss 125 0:00 \_ sh -s disksup
1288 1623 1623 1623 ? -1 Ss 125 0:00 \_ /opt/couchdb/bin/../lib/os_mon-2.4.2/priv/bin/memsup
1288 1624 1624 1624 ? -1 Ss 125 0:00 \_ /opt/couchdb/bin/../lib/os_mon-2.4.2/priv/bin/cpu_sup
1 1134 1134 1134 ? -1 Ss 0 0:02 php-fpm: master process (/etc/php/7.2/fpm/php-fpm.conf)
1134 1310 1134 1134 ? -1 S 33 0:00 \_ php-fpm: pool www
1134 1317 1134 1134 ? -1 S 33 0:00 \_ php-fpm: pool www
1 1137 1137 1137 ? -1 Ssl 0 0:00 /usr/bin/python3 /usr/share/unattended-upgrades/unattended-upgrade-shutdown --wait-for-sig
1 1156 1156 1156 ? -1 Ss 113 0:00 /usr/sbin/kerneloops --test
1 1165 1165 1165 ? -1 Ssl 0 0:00 /usr/sbin/gdm3
1165 1213 1165 1165 ? -1 Sl 0 0:00 \_ gdm-session-worker [pam/gdm-launch-environment]
1213 1364 1364 1364 tty1 1364 Ssl+ 121 0:00 | \_ /usr/lib/gdm3/gdm-wayland-session gnome-session --autostart /usr/share/gdm/greeter
1364 1368 1364 1364 tty1 1364 Sl+ 121 0:00 | \_ /usr/lib/gnome-session/gnome-session-binary --autostart /usr/share/gdm/greeter
1368 1377 1364 1364 tty1 1364 Sl+ 121 0:35 | \_ /usr/bin/gnome-shell
Look up Processes based on Process name
If you only want to list the process IDs for a given process name, and you can use pgrep command to lookup processes based on a given process name, and returns a process ID. For example, you want to display systemd process id, just type the following pgrep command:
$ pgrep systemd
Outputs:
devops@devops:~$ pgrep systemd
1
287
301
696
880
972
1352
3958
11789
11803
The pgrep command also can only mathch processes whose effective user ID is listed.
For example, you only want to list the process ID of system which is owner by a user called root user, just type:
$ pgrep -u root systemd
Outputs:
devops@devops:~$ pgrep -u root systemd
1
287
301
880
Show All Running Processes using htop Command
Htop tool is similar to top, but allows you to scroll vertically and horizontally, so you can see all the processes running on the system, along with their full command lines, as well as viewing them as a process tree, selecting multiple processes and acting on them all at once.
Htop is not installed by default on your Linux system, so you need to install it firstly with the following command:
For Ubuntu Linux:
$ sudo apt install htop
Outputs:
devops@devops:~$ sudo apt install htop
[sudo] password for devops:
Reading package lists... Done
Building dependency tree
Reading state information... Done
The following NEW packages will be installed:
htop
0 upgraded, 1 newly installed, 0 to remove and 143 not upgraded.
Need to get 80.0 kB of archives.
After this operation, 221 kB of additional disk space will be used.
Get:1 http://mirrors.aliyun.com/ubuntu bionic/main amd64 htop amd64 2.1.0-3 [80.0 kB]
Fetched 80.0 kB in 0s (211 kB/s)
Selecting previously unselected package htop.
(Reading database ... 186129 files and directories currently installed.)
Preparing to unpack .../htop_2.1.0-3_amd64.deb ...
Unpacking htop (2.1.0-3) ...
Processing triggers for mime-support (3.60ubuntu1) ...
Processing triggers for desktop-file-utils (0.23-1ubuntu3.18.04.2) ...
Processing triggers for man-db (2.8.3-2ubuntu0.1) ...
Processing triggers for gnome-menus (3.13.3-11ubuntu1.1) ...
Setting up htop (2.1.0-3) ...
For CentOS or RHEL Linux:
$ sudo yum install htop
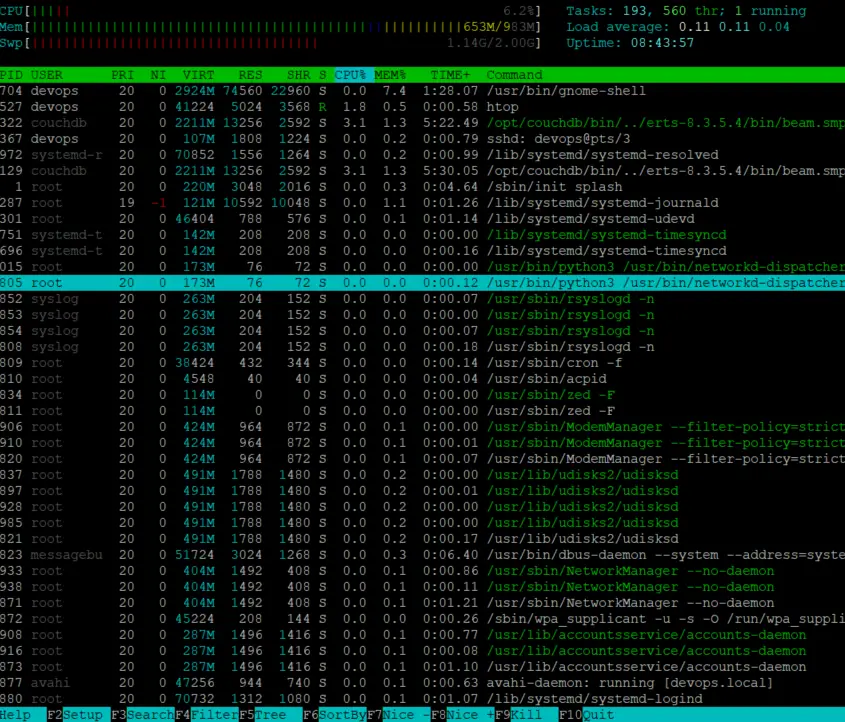
Once htop tool is installed on your Linux system, and you can type the htop command at the shell prompt to display an interactive process viewer.
$ htop
outputs:
Show All Running processes using atop Command
The program atop is an interactive monitor to view the load on a Linux system. It shows the occupation of the most critical hardware resources (from a performance point of view) on system level, i.e. cpu, memory, disk and network.
You can use the following command to install atop program firstly in your Linux system.
$ sudo apt install atop
Outputs:
devops@devops:~$ sudo apt install atop
Reading package lists... Done
Building dependency tree
Reading state information... Done
The following NEW packages will be installed:
atop
0 upgraded, 1 newly installed, 0 to remove and 143 not upgraded.
Need to get 132 kB of archives.
After this operation, 377 kB of additional disk space will be used.
Get:1 http://mirrors.aliyun.com/ubuntu bionic/universe amd64 atop amd64 2.3.0-1 [132 kB]
Fetched 132 kB in 0s (582 kB/s)
Selecting previously unselected package atop.
(Reading database ... 186138 files and directories currently installed.)
Preparing to unpack .../atop_2.3.0-1_amd64.deb ...
Unpacking atop (2.3.0-1) ...
Setting up atop (2.3.0-1) ...
Created symlink /etc/systemd/system/multi-user.target.wants/atop.service → /lib/systemd/system/atop.service.
Created symlink /etc/systemd/system/multi-user.target.wants/atopacct.service → /lib/systemd/system/atopacct.service.
Processing triggers for ureadahead (0.100.0-21) ...
Processing triggers for systemd (237-3ubuntu10.28) ...
Processing triggers for man-db (2.8.3-2ubuntu0.1) ...
If you are using a CentOS or RHEL Linux, and you can use the following yum command to install it, type:
$ sudo yum install atop
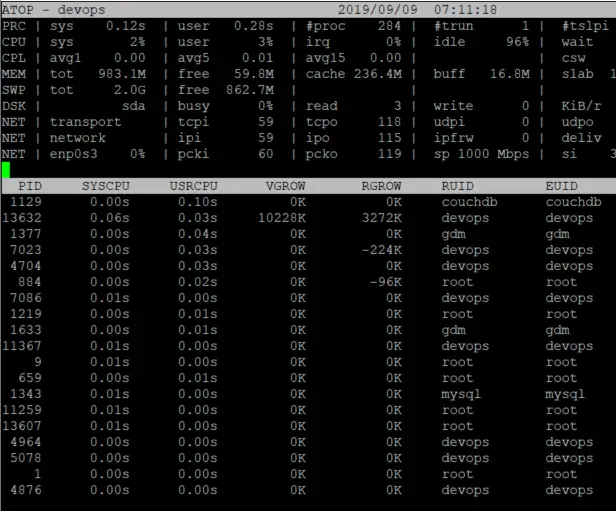
Then you can type the following atop command to display advanced system and process monitor.
$ atop
Outputs:
If you want to get more information about those commands, and you can get it from man page, type the following commands:
$ man ps
$ man top
$ man pgrep
$ man atop
$ man htop
Conclusion
You should know that how to show all running processes through the different commands (ps,top,pgrep,atop and htop)at the shell prompt in CentOS or RHEL or Ubuntu Linux system.