CentOS 7 /RHEL: 3 useful commands to view system processes
In this post you will see how to check system processes using the below command to check system processes under centos 7 or RHEL 7 operating system.
#1 ps command – allows you to display information about running processes in your current system.
#2 top command – this command will dispalys a real-time list of processes that are running on the system. it can display system summary information as well as list of processes or threads currently being managed by linux kernel.
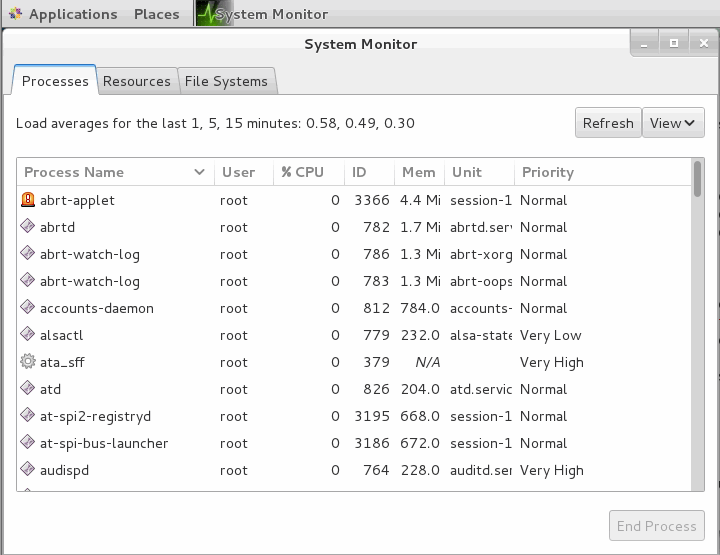
#3 system monitor tool – this is a GUI program to use to view the cpu usage, memory usage of current processes.
CentOS 7 view system processes using “ps” command
To list all processes that are currently running on the system including processes owned by others users, issue the following command:
ps aux
Outputs:
[root@osetc /]# ps aux

USER       PID %CPU %MEM    VSZ   RSS TTY      STAT START   TIME COMMAND

root         1  0.0  0.3 216908  3820 ?        Ss   Dec14   0:14 /usr/lib/systemd/systemd --sw

root         2  0.0  0.0      0     0 ?        S    Dec14   0:00 [kthreadd]

root         3  0.0  0.0      0     0 ?        S    Dec14   0:03 [ksoftirqd/0]

root         5  0.0  0.0      0     0 ?        S<   Dec14   0:00 [kworker/0:0H]

root         7  0.0  0.0      0     0 ?        S    Dec14   0:00 [migration/0]

root         8  0.0  0.0      0     0 ?        S    Dec14   0:00 [rcu_bh]

root         9  0.0  0.0      0     0 ?        S    Dec14   0:00 [rcuob/0]

root        10  0.0  0.0      0     0 ?        S    Dec14   0:00 [rcuob/1]

root        11  0.0  0.0      0     0 ?        S    Dec14   0:00 [rcuob/2]

root        12  0.0  0.0      0     0 ?        S    Dec14   0:00 [rcuob/3]

root        13  0.0  0.0      0     0 ?        S    Dec14   0:00 [rcuob/4]

root        14  0.0  0.0      0     0 ?        S    Dec14   0:00 [rcuob/5]

root        15  0.0  0.0      0     0 ?        S    Dec14   0:00 [rcuob/6]

root        16  0.0  0.0      0     0 ?        S    Dec14   0:00 [rcuob/7]

root        17  0.0  0.0      0     0 ?        S    Dec14   0:00 [rcuob/8]

root        18  0.0  0.0      0     0 ?        S    Dec14   0:00 [rcuob/9]

root        19  0.0  0.0      0     0 ?        S    Dec14   0:00 [rcuob/10]
This command will display the process ID(PID), the terminal associated with the process(TTY), the cumulated CPU time in hh:mm:ss format(TIME) and the executeable name (COMMAND), the effective username of the process owner(USER), the percentage of the CPU(CPU), and memory usage(MEM)
To check one particualar process named httpd,type the following command:
ps aux | grep httpd
Outputs:
[root@osetc/]# ps aux | grep httpd

root     39039  3.2  1.4 449460 14700 ?        Ss   02:58   0:00 /usr/sbin/httpd -DFOREGROUND

apache   39041  0.0  0.7 451544  7780 ?        S    02:58   0:00 /usr/sbin/httpd -DFOREGROUND

apache   39042  0.0  0.7 451544  7780 ?        S    02:58   0:00 /usr/sbin/httpd -DFOREGROUND

apache   39043  0.0  0.7 451544  7780 ?        S    02:58   0:00 /usr/sbin/httpd -DFOREGROUND

apache   39044  0.0  0.7 451544  7780 ?        S    02:58   0:00 /usr/sbin/httpd -DFOREGROUND

apache   39047  0.0  0.7 451544  7780 ?        S    02:58   0:00 /usr/sbin/httpd -DFOREGROUND

root     39051  0.0  0.0 112640   976 pts/2    S+   02:58   0:00 grep --color=auto httpd

[root@osetc /]#
CentOS 7 view system processes using top command
The top command provides a dynamic real-time view of a running system. it can display system summary infomration as well as a list of processes or threads currently being managed by the linux kernel.
To display real-time processes that are running on the system, issue the following command:
top
Outputs:
[root@osetc /]# top

top - 03:03:17 up 1 day, 29 min,  4 users,  load average: 0.02, 0.07, 0.12

Tasks: 306 total,   3 running, 303 sleeping,   0 stopped,   0 zombie

%Cpu(s): 48.5 us,  4.1 sy,  0.0 ni, 47.5 id,  0.0 wa,  0.0 hi,  0.0 si,  0.0 st

KiB Mem:   1010860 total,   932044 used,    78816 free,        0 buffers

KiB Swap:  2129916 total,   140144 used,  1989772 free.   161596 cached Mem

PID USER      PR  NI    VIRT    RES    SHR S %CPU %MEM     TIME+ COMMAND

7889 devops    20   0 1684604 358340   8388 R 41.7 35.4  18:28.95 gnome-shell

6564 root      20   0  193088  29220   1984 S  7.6  2.9   1:48.72 Xorg

8261 devops    20   0  630472  11324   3484 S  2.0  1.1   0:23.79 gnome-terminal-

8093 devops    20   0  144908    604    388 S  0.3  0.1   0:30.98 escd

8094 devops    20   0  447792   3820   1584 S  0.3  0.4   2:31.47 vmtoolsd

39066 root      20   0       0      0      0 S  0.3  0.0   0:00.24 kworker/0:1

1 root      20   0  216908   4816   2284 S  0.0  0.5   0:14.39 systemd

2 root      20   0       0      0      0 S  0.0  0.0   0:00.07 kthreadd

3 root      20   0       0      0      0 S  0.0  0.0   0:03.27 ksoftirqd/0

5 root       0 -20       0      0      0 S  0.0  0.0   0:00.00 kworker/0:0H

7 root      rt   0       0      0      0 S  0.0  0.0   0:00.00 migration/0

8 root      20   0       0      0      0 S  0.0  0.0   0:00.00 rcu_bh

9 root      20   0       0      0      0 S  0.0  0.0   0:00.00 rcuob/0

10 root      20   0       0      0      0 S  0.0  0.0   0:00.00 rcuob/1

11 root      20   0       0      0      0 S  0.0  0.0   0:00.00 rcuob/2
This command will display the process owner (USER), the priority(PR), the nice value(NI), the amount of virtual memory the process uses(VIRT), the percentage of the CPU(CPU), the memory usage (MEM), the cumulated CPU time(TIME), the name of the executable file(COMMAND).
CentOS 7 view system processes using the system monitor tool
To start “system monitor” tool, click “Application“->”system tools” ->”system monitor“, then system will pop-up a “system monitor” window. this tool is similar with the “Task Manager” in the windows operating system.

